Charts
You can get a visual view of your grants data with charts in Grant Frog
📊Charts
You now have a visual of your grants data! You can see charts for totals, users, and proposal status.
Access them by clicking Reports > Charts on the menu.
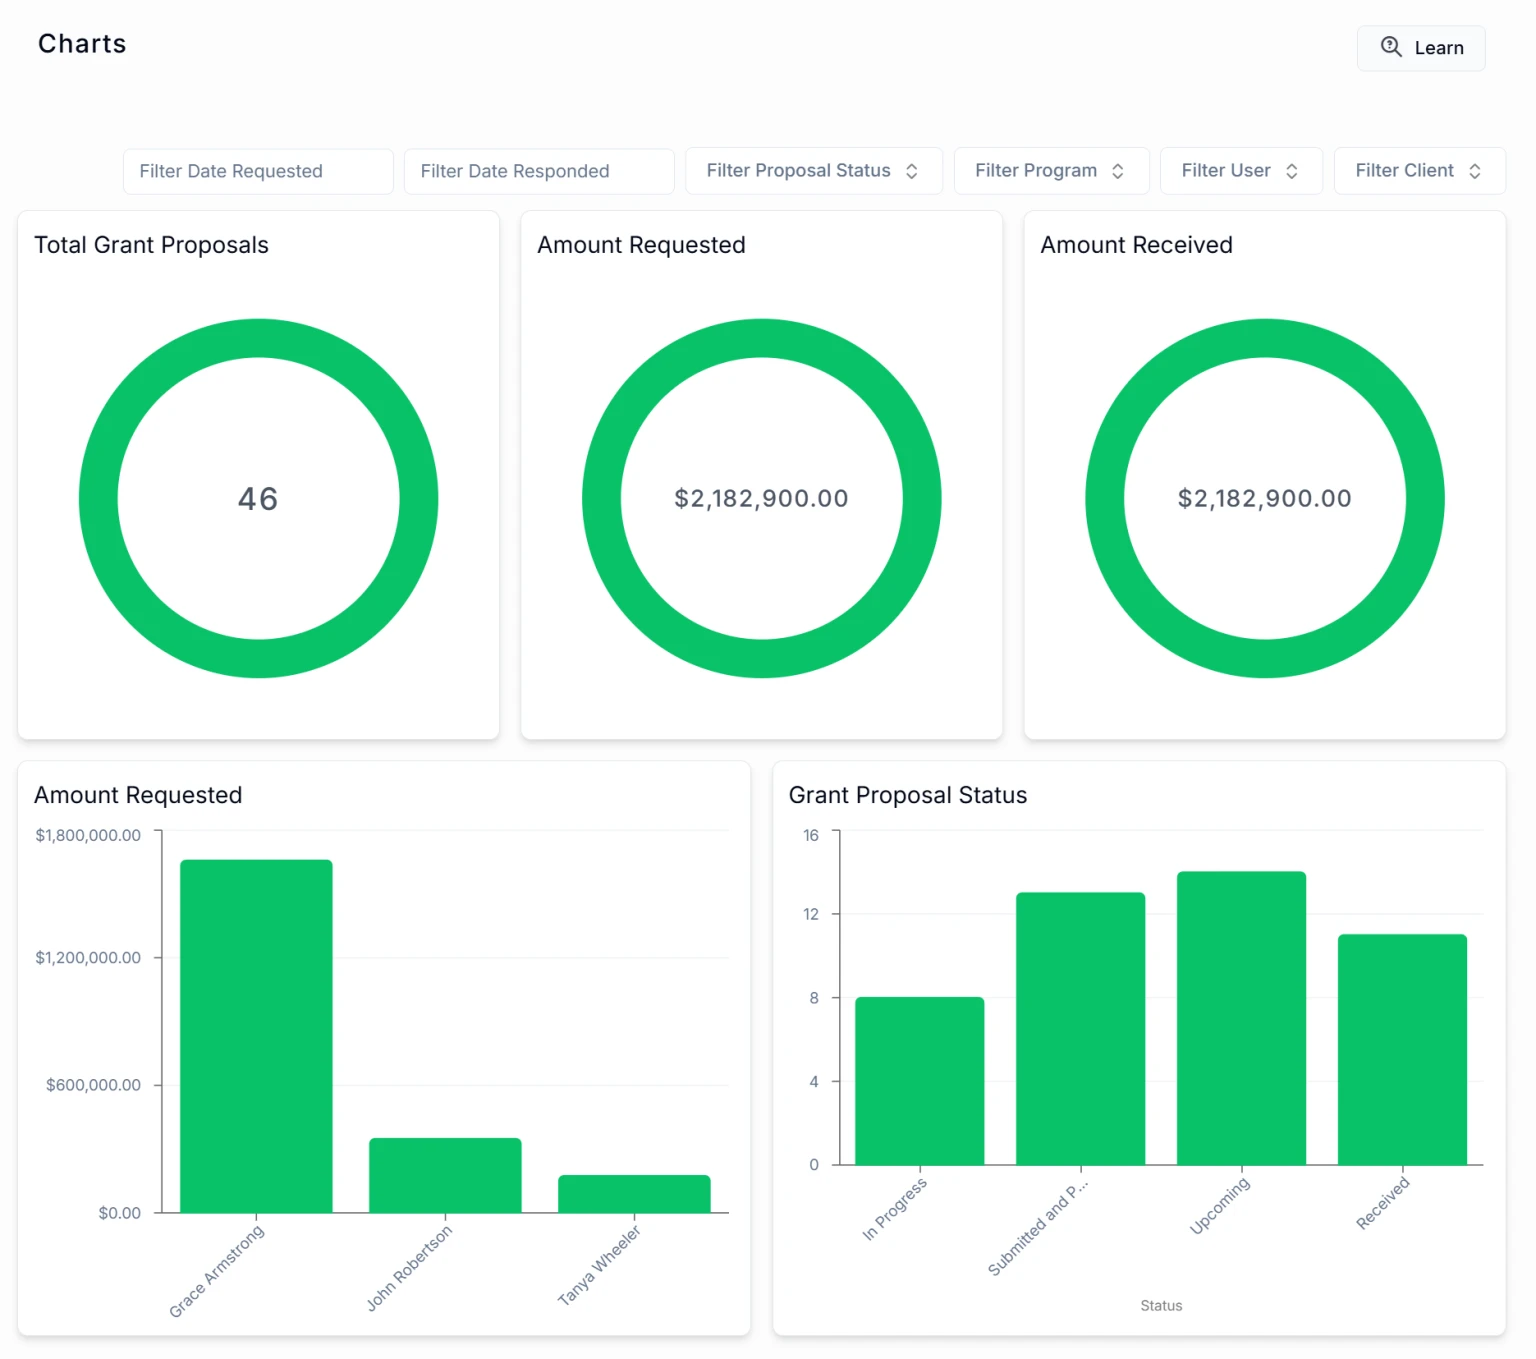
You can these choose your Filters -
Date Requested
Date Responded
Proposal Status
Program
User
Client
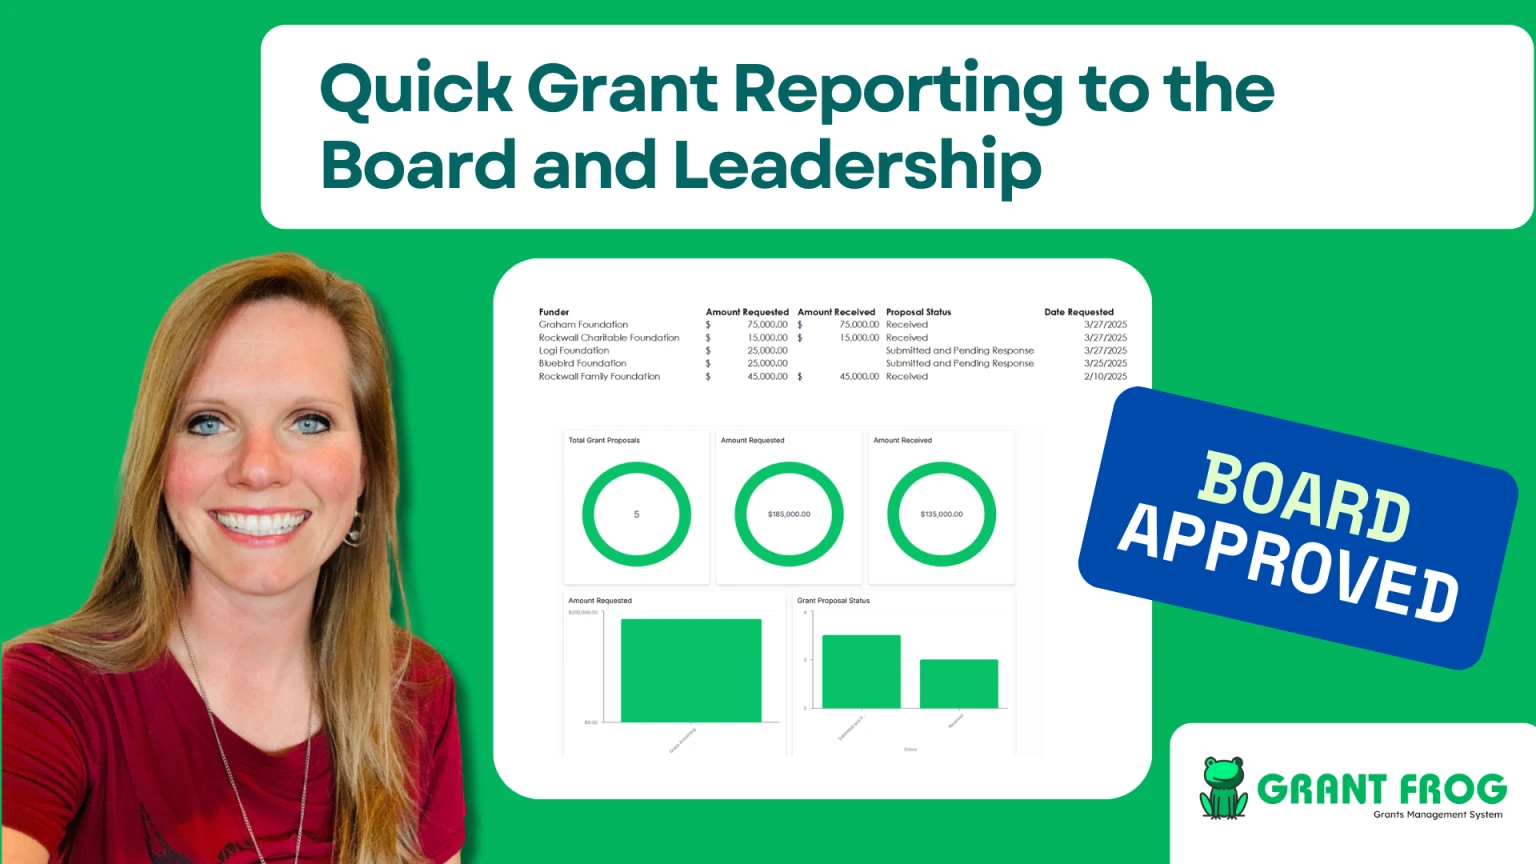
Learn how to create Reports for Leadership
📽️ Watch video
If you need to print this image, you'll need to use the screen capture on your device or you can use a Chrome extension, such as GoFullPage